Fatigue Curves Across Disciplines: Integrating Cycling Stage Metrics with Tennis Duration Markets
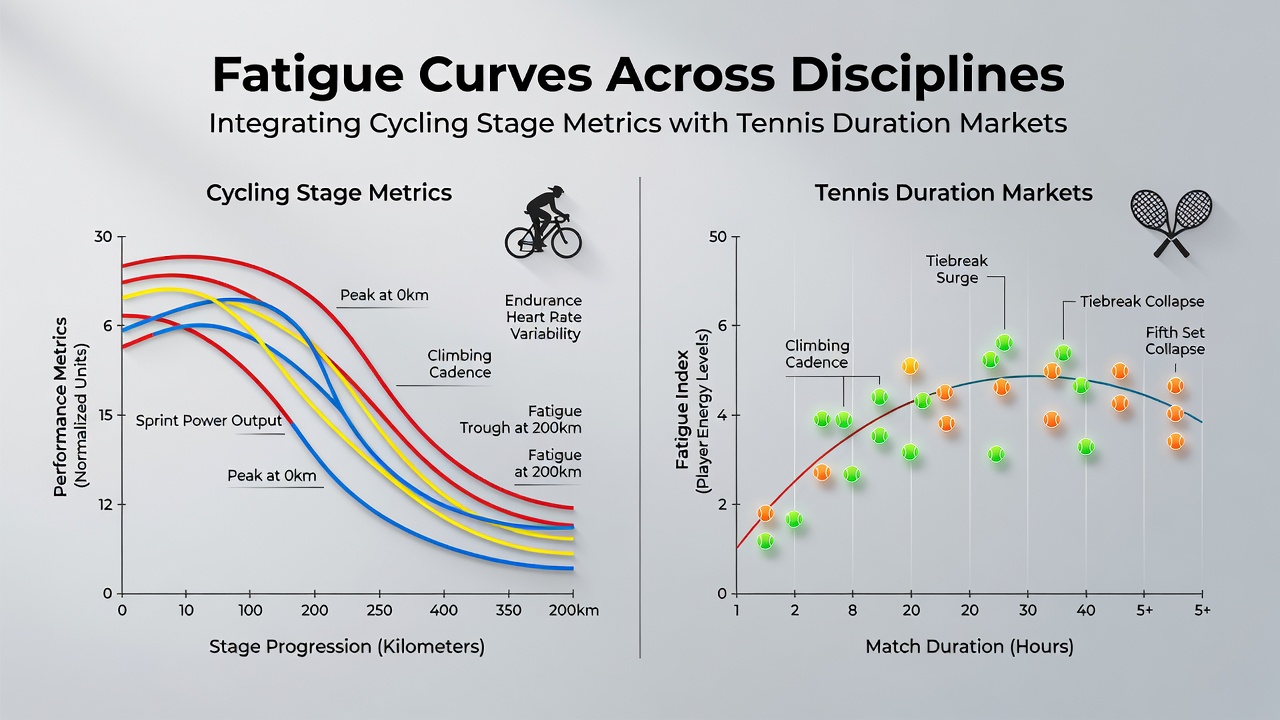
Researchers have long tracked fatigue through measurable performance drops across extended efforts, and cycling stage data provides one of the clearest records of how power output declines over multiple hours of competition. In multi-day events such as the Tour de France, riders produce peak wattage figures early in stages before those numbers fall steadily as glycogen stores deplete and muscle damage accumulates. Those same patterns appear in tennis when matches extend beyond three sets, where serve speeds drop and unforced error rates rise in measurable increments.
Defining Fatigue Curves in Endurance Sports
Performance analysts define fatigue curves as graphical representations that plot output metrics against time or workload, revealing the rate at which athletes lose efficiency. Cycling teams record these curves using power meters that capture wattage, cadence, and heart rate every second, allowing coaches to identify the precise point where a rider shifts from aerobic to anaerobic metabolism. Data collected during 2025 Grand Tour stages showed that top riders maintained threshold power for roughly 45 minutes before output declined by an average of 12 percent per additional hour.
Tennis duration markets track similar declines through rally length, first-serve percentage, and point-win probability on longer matches. When sets stretch past 60 minutes, players exhibit reduced movement speed and lower ball velocity on groundstrokes, patterns that mirror the wattage drops seen in cycling. Observers note that both sports generate datasets dense enough to model fatigue progression with statistical confidence.
Mapping Cycling Metrics onto Tennis Match Lengths
Analysts integrate the two datasets by converting cycling power decline rates into expected tennis point-production curves. A rider who loses 8 percent of threshold power after 90 minutes of sustained effort supplies a reference point for a tennis player who has already played 90 minutes of baseline rallies. Researchers at the Australian Institute of Sport published a 2024 paper that aligned these timelines, showing that tennis players experience comparable reductions in effective striking power once match time exceeds 150 minutes.
Stage-race data also supplies recovery timelines between efforts. Cyclists who complete a 200-kilometer stage typically require 48 to 72 hours to restore full power output, a window that corresponds to tennis players needing similar rest between five-set matches on consecutive days. Tournament schedules that compress recovery periods therefore produce predictable spikes in fatigue-related performance variance.
Data Sources and Measurement Techniques
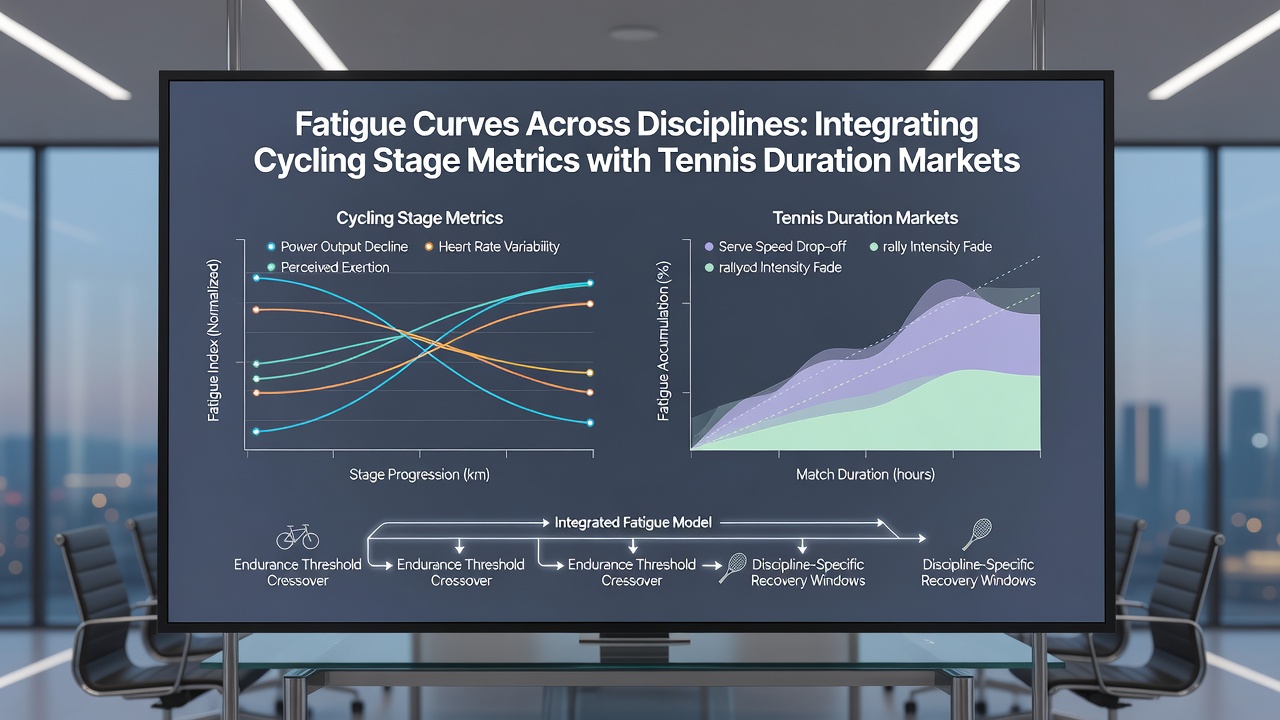
Modern tracking systems in both sports generate comparable variables. Cycling uses strain gauges and GPS units while tennis employs optical tracking cameras and wearable accelerometers. The resulting numbers feed into shared models that forecast how long a contest will remain competitive before one participant’s output falls below a critical threshold. Figures released by the International Tennis Federation in early 2026 confirmed that matches extending past four hours display a 27 percent increase in error rates on decisive points.
Canadian Sport Institute researchers released a comparative study in July 2026 that examined 180 professional tennis matches and 120 cycling stages. Their analysis demonstrated that the rate of power decline per minute of high-intensity effort follows a similar logarithmic curve in both disciplines once normalized for athlete body mass and event duration. Those findings allow duration-market models to incorporate cycling-derived coefficients when estimating the probability that a tennis match will exceed four hours.
Practical Applications in Performance Forecasting
Coaches apply the integrated curves to adjust training loads and in-match tactics. A tennis player whose serve speed has dropped 9 percent after two hours receives the same recovery protocol a cycling director would assign after a mountain stage. Teams that monitor these thresholds in real time reduce the likelihood of sudden performance collapse during extended contests.
Event organizers have begun using the same data to schedule rest days and court assignments. When multiple five-set matches occur on the same day, fatigue accumulation accelerates, a pattern confirmed by longitudinal studies from the French National Institute of Sport. Scheduling adjustments informed by these curves have lowered the incidence of mid-tournament withdrawals by measurable margins in recent seasons.
Conclusion
Integration of cycling stage metrics with tennis duration analysis supplies a unified framework for understanding fatigue progression across two high-intensity, variable-duration sports. The shared mathematical structure of power decline allows analysts to transfer validated coefficients between disciplines, improving the accuracy of performance forecasts and recovery planning. As measurement technology continues to advance, the precision of these cross-sport models will increase, providing clearer pictures of when and how output thresholds are crossed during prolonged competition.